Organizational Evolution Starts with Byte-sized Innovation
Businesses are constantly seeking to streamline and optimize their processes to achieve operational efficiency and ensure consistent quality. Our client, a leading renewable energy consultancy firm based in Dubai, sought our expertise in streamlining and digitalizing their processes and operations. This comprehensive transformation included data standardization and management, streamlining reporting processes and digitalizing collaboration among multiple stakeholders.
An In-Depth Discovery and Outlining Challenges
Our discovery followed an established SOP to thoroughly understand the client’s existing processes. Through this initial deep dive, we identified three primary challenges that both internal and external stakeholders face:
Efficient analysis and report generation were hindered by data silos and inconsistencies with data being stored in different formats.
Low efficiency, poor time utilization and confusion arose due to the usage of multiple communication channels - emails, phone calls, and various documents.
Delays in receiving feedback on reports, which in turn prolonged project timelines, further impeding progress and decision-making.
In response to these challenges, we proposed a tailored solution —a dynamic platform designed to enhance efficiency and user experience through standardized data collection and streamlined data processing and management. This solution also promised comprehensive reporting and actionable insights for all stakeholders.
Our Approach: Explore, Experiment and Engineer
Discover and Explore
Adopting an agile methodology, we strategically set realistic milestones throughout the project development phase. During several deep-dive sessions, it became apparent that each consultant had a distinct process for obtaining input from their respective end clients. Our focus was to streamline and digitalize the processes.
Derive & Experiment
Building upon these insights, we kicked off with the development of a functional Minimum Viable Product using Google Sheets. We pieced together the commonalities across each of the consultant’s processes. Our team identified workflow sequences and mapped out user interactions across various processes. This enabled us to validate data standards and streamline processes.
Design & Engineer
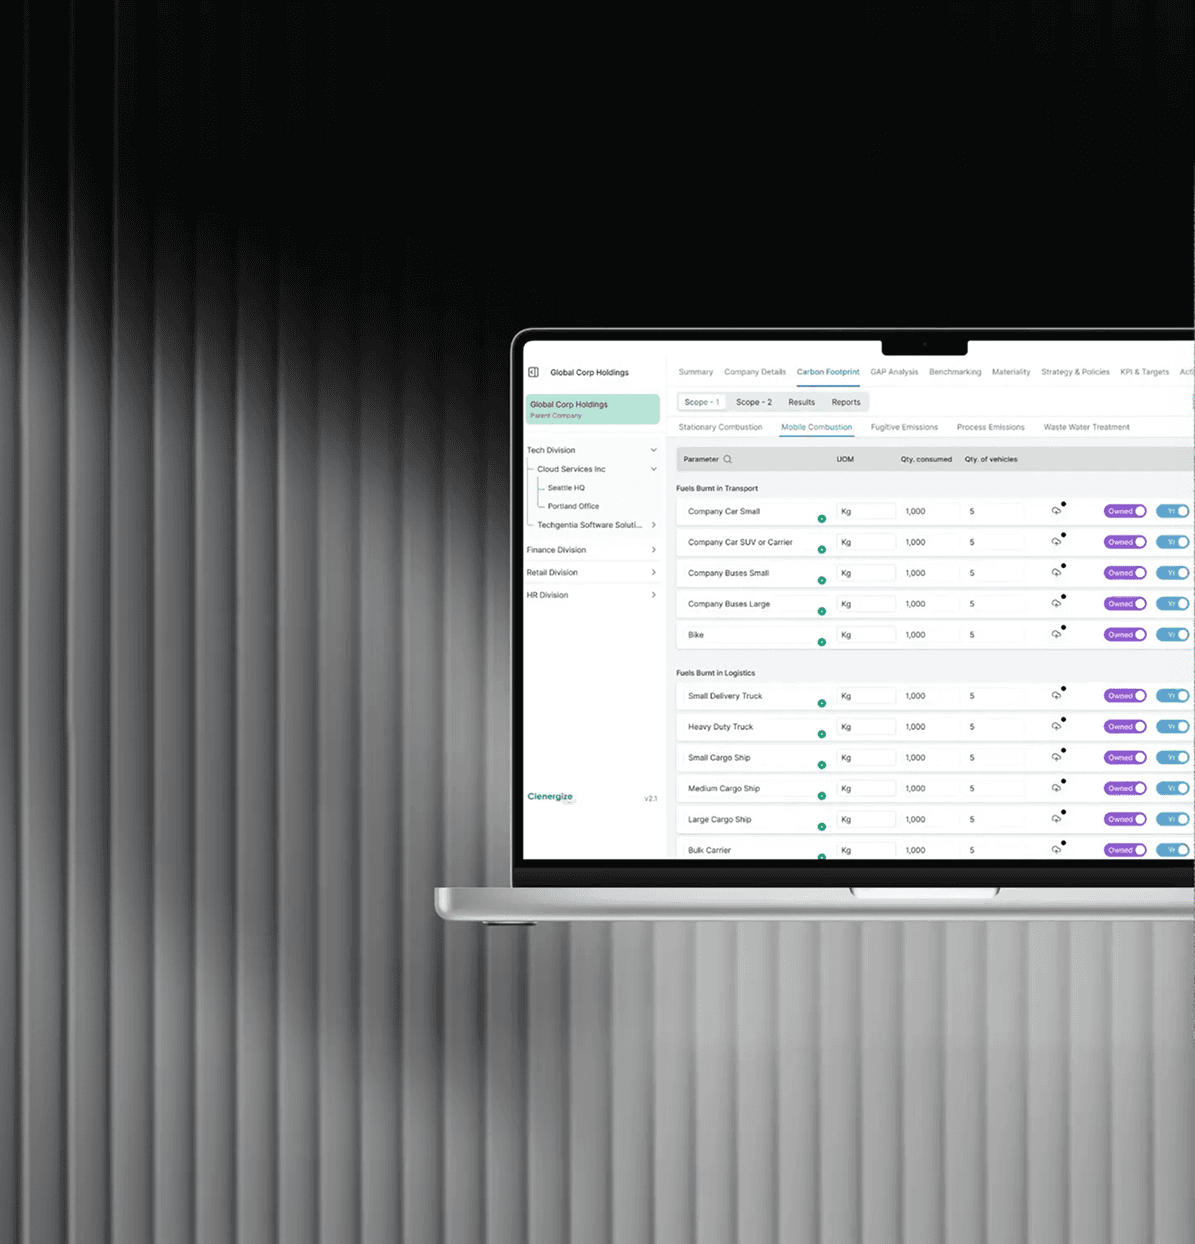
Building upon the insights from the MVP validation process, we designed and developed a custom portal that is easily editable by stakeholders. We designed a dynamic platform, allowing users to configure and customize the portal with pre-built functionalities and custom entries as per project requirements. Additionally, we incorporated an instructions tab in the portal’s sidebar, making it easy for stakeholders and end-users to navigate and use the portal.
We further focused on enhancing the reporting capabilities of the portal with a dynamic visualization tool. This empowered the client and stakeholders to easily view and interpret visualization graphs and reports.
To address the communication gaps and optimize and digitalize collaboration among stakeholders, we built and implemented system checks and automated communication channels, such as alerts and chats.
Improved clarity and productivity with Immediate Impact
The development and implementation of the platform has yielded tangible benefits.
Rapid onboarding of over 12 projects within 60 days post-completion.
Over 60% reduction in data capture and processing time, expediting project timelines.
Standardized processes and intuitive reporting tools enhanced internal and external stakeholder engagement.
Custom configuration of project template suitable to their unique clients
Automation of data analysis and results
For internal stakeholders, the portal streamlined and standardized processes, eliminating the need to refer to multiple sheets for data analyses. For external stakeholders, the graphs and reports made it easier to analyze and interpret data. This solution has brought clarity and transparency to the client, fostering improved communication and collaboration among multiple stakeholders.